CI/CD Pipelines Explained: How to Ship Software Fast Without Breaking Everything
- Turker Senturk
- Software
- 26 Dec, 2025
- 18 min read
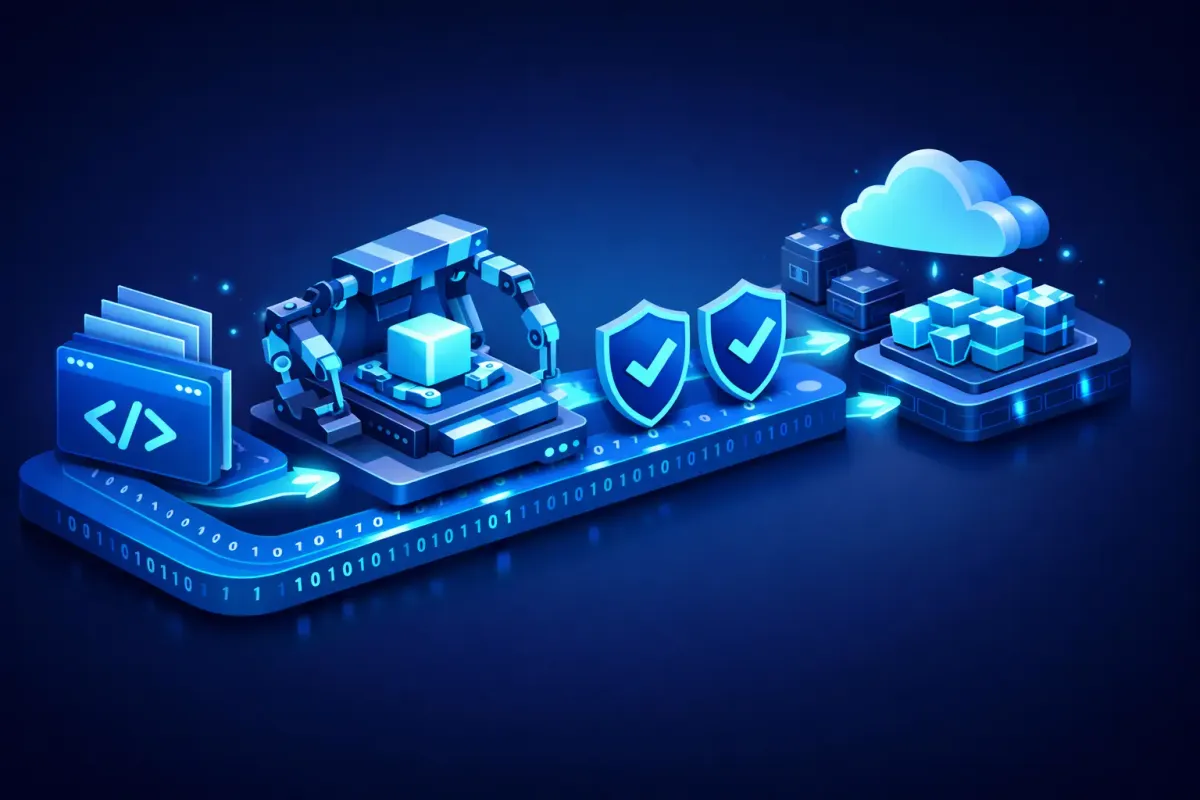
Modern software teams are expected to ship updates multiple times per day. But speed without stability? That’s just chaos with fancier tools. The real challenge is building pipelines that move fast and keep things running smoothly. This guide breaks down everything you need to know about CI/CD pipelines, testing strategies, deployment patterns, and the cultural shifts that make frequent releases possible without the anxiety.
What Actually Happens in a CI/CD Pipeline?
flowchart TB
    subgraph CI["Continuous Integration"]
        A1[Code Commit] --> A2[Automated Build] --> A3[Automated Tests]
    end

    subgraph CD_Delivery["Continuous Delivery"]
        B1[CI Complete] --> B2[Deploy to Staging] --> B3[Manual Approval] --> B4[Production Release]
    end

    subgraph CD_Deployment["Continuous Deployment"]
        C1[CI Complete] --> C2[Auto Deploy Staging] --> C3[Auto Deploy Production]
    end

    A3 -.-> B1
    A3 -.-> C1

    style CI fill:#4A90D9,stroke:#2E5A8B,color:#fff
    style CD_Delivery fill:#70C1B3,stroke:#4A9A8C,color:#fff
    style CD_Deployment fill:#E76F51,stroke:#C4503A,color:#fff
Think of a CI/CD pipeline as an assembly line for your code. Every time a developer makes a change, the pipeline takes that change through a series of automated steps until it’s ready for users. Here’s the typical journey:
Source is where it all starts. Developers commit small, focused changes to the main branch. Teams practicing trunk-based development keep their branches short-lived and merge frequently, while those using GitFlow work with longer-lived feature branches—though this approach often leads to merge conflicts and delays.
Build comes next. Automated scripts compile the code, create container images, and package everything needed for deployment. With true continuous integration, every merge triggers this build process automatically.
Test is where automated test suites verify that everything works correctly. They check for bugs, security issues, and performance problems. The pipeline moves only as fast as its slowest test, so speed matters here.
Artifact storage follows successful testing. The tested code gets stored in a registry so it can be deployed consistently every time.
Deploy is the final step. The pipeline promotes artifacts through environments—typically from staging to production. Here’s where the terminology gets specific: continuous delivery means your code is always ready for production but requires a manual approval to go live, while continuous deployment takes it further by automatically releasing every change that passes all tests.
Trunk-Based Development vs. GitFlow: Which Approach Works Better?
These two branching strategies represent fundamentally different philosophies about how teams should manage their code.
| Aspect | Trunk-Based Development | GitFlow |
|---|---|---|
| Branch Lifespan | Short-lived (hours to a day) | Long-lived feature branches |
| Merge Frequency | At least daily | Less frequent, larger merges |
| Merge Conflicts | Minimal due to frequent integration | Common due to branch divergence |
| Main Branch State | Always deployable | May not be immediately deployable |
| Feature Management | Uses feature flags | Uses branch isolation |
| Release Speed | Faster releases | Slower, more controlled releases |
| Best For | Teams with strong automated testing | Teams needing strict release control |
Trunk-based development encourages committing small, incremental changes directly to the main branch. Teams using this approach typically pair it with feature flags to hide unfinished work from users while still integrating code frequently. The main branch stays releasable at all times.
gitGraph
    commit id: "v1.0"
    branch short-lived-fix
    commit id: "small-fix"
    checkout main
    merge short-lived-fix id: "quick-merge-1"
    commit id: "feature-part-1"
    branch short-lived-feat
    commit id: "small-change"
    checkout main
    merge short-lived-feat id: "quick-merge-2"
    commit id: "v1.1" tag: "deploy"
GitFlow, on the other hand, maintains separate develop and master branches with dedicated feature branches. While this provides clear separation, it often results in painful merges when branches have diverged significantly over time.
gitGraph
    commit id: "initial"
    branch develop
    checkout develop
    commit id: "sprint-start"
    branch feature/user-auth
    commit id: "auth-work"
    checkout develop
    checkout feature/user-auth
    commit id: "auth-done"
    checkout develop
    merge feature/user-auth id: "merge-to-dev"
    branch release/v1.0
    commit id: "bug-fix-on-rel"
    checkout main
    merge release/v1.0 id: "PROD-v1.0" tag: "v1.0"
    checkout develop
    merge release/v1.0 id: "sync-dev"
The Testing Pyramid: Getting the Balance Right
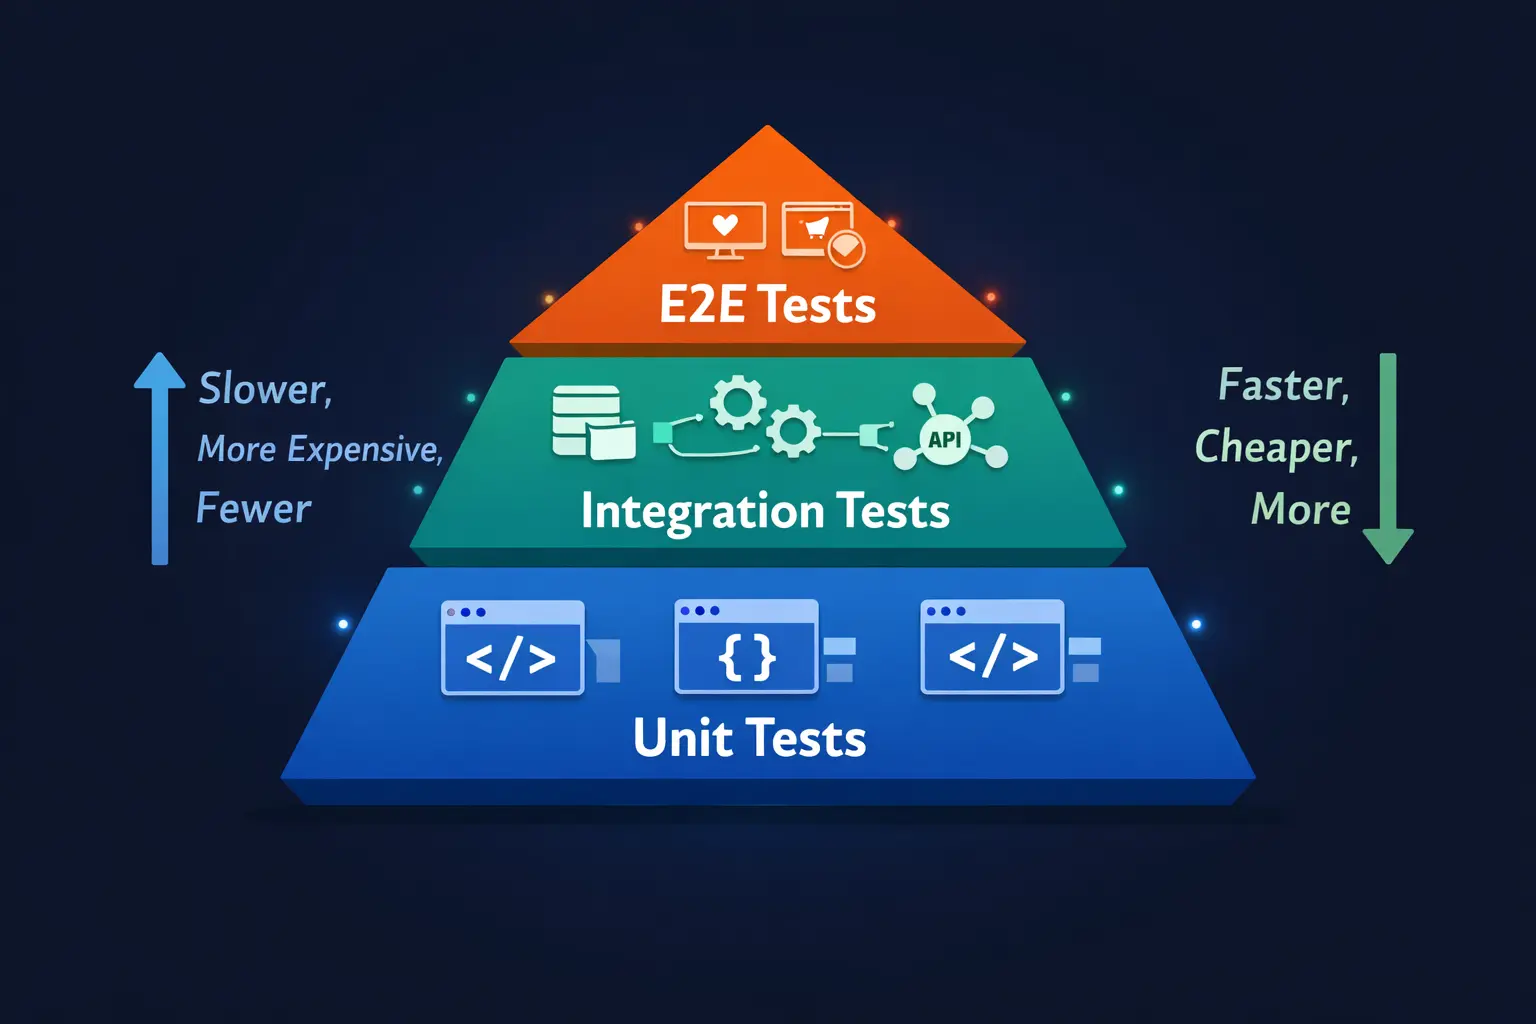
Not all tests are created equal, and the “testing pyramid” helps teams understand how to balance different test types for maximum effectiveness.
Unit tests form the broad base of the pyramid. They’re fast, numerous, and cheap to maintain. These tests verify individual functions and provide rapid feedback when something breaks. Teams should have the most of these.
Integration tests sit in the middle layer. They validate how different components work together—for example, how your application talks to a database or external API. These tests catch issues that unit tests miss but take longer to run.
End-to-end (E2E) tests occupy the apex. They verify complete user journeys through the entire system. While powerful for catching real-world issues, they’re slower and more brittle than other test types. Use them sparingly for critical paths.
The key insight here is that following this pyramid structure helps catch bugs early while keeping pipelines fast enough that developers actually use them.
Security Gates Every Pipeline Needs
flowchart LR
    %% Genel Düğüm Stilleri (Opsiyonel, diğer kutuları da güzelleştirmek isterseniz açın)
    %% classDef default fill:#f9f9f9,stroke:#333,stroke-width:1px,color:#333;

    subgraph Pipeline["CI/CD Pipeline with Security Gates"]
        CODE[Source Code] --> SAST

        subgraph Gates["Security Gates"]
            style Gates fill:#f4f7fc,stroke:#dfe6e9,color:#2d3436
            SAST["SAST<br/>Static Analysis"]
            SCA["SCA<br/>Dependency Check"]
            DAST["DAST<br/>Dynamic Testing"]
        end

        SAST --> BUILD[Build]
        BUILD --> SCA
        SCA --> TEST[Tests]
        TEST --> DEPLOY[Deploy to Test Env]
        DEPLOY --> DAST
        DAST --> PROD[Production]
    end

    %% Mor tonu - Analiz için
    style SAST fill:#6C5CE7,stroke:#4a3f9e,color:#fff,stroke-width:2px
    %% Turkuaz tonu - Kontrol için
    style SCA fill:#00CEC9,stroke:#008f8c,color:#fff,stroke-width:2px
    %% Mavi tonu - Test için
    style DAST fill:#0984e3,stroke:#065a9c,color:#fff,stroke-width:2px
Functional testing isn’t enough anymore. Modern pipelines incorporate multiple security checkpoints:
| Security Tool | What It Does | When It Runs |
|---|---|---|
| SAST (Static Application Security Testing) | Scans source code for vulnerability patterns like SQL injection and buffer overflows | Early in pipeline, before code executes |
| DAST (Dynamic Application Security Testing) | Tests the running application like an external attacker would | After deployment to test environment |
| SCA (Software Composition Analysis) | Checks third-party dependencies for known vulnerabilities (CVEs) | During build phase |
| Performance Testing | Catches speed and reliability regressions | Tiered approach: smoke tests on every commit, load tests nightly |
Tools like OWASP Dependency-Check can scan your project dependencies and flag libraries with known security issues. This addresses the often-overlooked problem of vulnerable third-party components that many teams inherit without realizing the risks.
For performance testing, a tiered approach works best: run quick smoke tests (2-5 minutes) on every commit, more realistic load tests on nightly builds, and comprehensive stress tests before major releases.
Deployment Strategies Compared: Blue-Green, Rolling, and Canary
Choosing the right deployment strategy can mean the difference between a smooth release and a customer-facing disaster. Here’s how the main approaches compare:
| Strategy | How It Works | Pros | Cons | Best For |
|---|---|---|---|---|
| Blue-Green | Maintains two identical environments; switches traffic between them | Zero downtime, instant rollback | Requires double infrastructure | Apps needing guaranteed uptime |
| Rolling | Updates servers incrementally in batches | Resource efficient, continuous availability | Complex rollbacks, mixed versions temporarily | Large-scale applications |
| Canary | Deploys to small user subset first, then expands | Granular risk control, real user feedback | Requires strong monitoring | High-risk changes, new features |
| Feature Flags | Code deployed but hidden behind toggles | Decouples deployment from release | Flag management overhead | A/B testing, gradual rollouts |
Blue-Green Deployments in Practice
flowchart TB
    subgraph Phase1["Phase 1: Blue is Live"]
        LB1[Load Balancer] --> BLUE1["🔵 Blue Environment<br/>v1.0 - LIVE"]
        GREEN1["🟢 Green Environment<br/>v1.1 - Deploying"]
    end

    subgraph Phase2["Phase 2: Switch Traffic"]
        LB2[Load Balancer] -.-> BLUE2["🔵 Blue Environment<br/>v1.0 - Standby"]
        LB2 --> GREEN2["🟢 Green Environment<br/>v1.1 - LIVE"]
    end

    subgraph Phase3["Phase 3: Rollback if Needed"]
        LB3[Load Balancer] --> BLUE3["🔵 Blue Environment<br/>v1.0 - LIVE"]
        GREEN3["🟢 Green Environment<br/>v1.1 - Failed"]
    end

    Phase1 --> Phase2
    Phase2 -.->|"Issues Detected"| Phase3

    style BLUE1 fill:#4A90D9,stroke:#2E5A8B,color:#fff
    style GREEN1 fill:#70C1B3,stroke:#4A9A8C,color:#fff
    style BLUE2 fill:#4A90D9,stroke:#2E5A8B,color:#fff
    style GREEN2 fill:#70C1B3,stroke:#4A9A8C,color:#fff
    style BLUE3 fill:#4A90D9,stroke:#2E5A8B,color:#fff
    style GREEN3 fill:#E76F51,stroke:#C4503A,color:#fff
With blue-green deployment, you maintain two identical production environments. One (blue) serves live traffic while the other (green) receives the new release. After verification, you simply flip traffic to green. Problems? Flip back to blue instantly.
The trade-off is clear: you get minimal downtime and straightforward rollback, but you’re paying for twice the infrastructure.
Rolling Deployments
flowchart TB
    subgraph Step1["Step 1: Initial State"]
        direction LR
        S1A["Server 1<br/>v1.0"]
        S1B["Server 2<br/>v1.0"]
        S1C["Server 3<br/>v1.0"]
        S1D["Server 4<br/>v1.0"]
    end

    subgraph Step2["Step 2: Update First Batch"]
        direction LR
        S2A["Server 1<br/>v2.0 ✓"]
        S2B["Server 2<br/>v1.0"]
        S2C["Server 3<br/>v1.0"]
        S2D["Server 4<br/>v1.0"]
    end

    subgraph Step3["Step 3: Continue Rolling"]
        direction LR
        S3A["Server 1<br/>v2.0 ✓"]
        S3B["Server 2<br/>v2.0 ✓"]
        S3C["Server 3<br/>v1.0"]
        S3D["Server 4<br/>v1.0"]
    end

    subgraph Step4["Step 4: Complete"]
        direction LR
        S4A["Server 1<br/>v2.0 ✓"]
        S4B["Server 2<br/>v2.0 ✓"]
        S4C["Server 3<br/>v2.0 ✓"]
        S4D["Server 4<br/>v2.0 ✓"]
    end

    Step1 --> Step2 --> Step3 --> Step4

    style S1A fill:#4A90D9,stroke:#2E5A8B,color:#fff
    style S1B fill:#4A90D9,stroke:#2E5A8B,color:#fff
    style S1C fill:#4A90D9,stroke:#2E5A8B,color:#fff
    style S1D fill:#4A90D9,stroke:#2E5A8B,color:#fff
    style S2A fill:#70C1B3,stroke:#4A9A8C,color:#fff
    style S3A fill:#70C1B3,stroke:#4A9A8C,color:#fff
    style S3B fill:#70C1B3,stroke:#4A9A8C,color:#fff
    style S4A fill:#70C1B3,stroke:#4A9A8C,color:#fff
    style S4B fill:#70C1B3,stroke:#4A9A8C,color:#fff
    style S4C fill:#70C1B3,stroke:#4A9A8C,color:#fff
    style S4D fill:#70C1B3,stroke:#4A9A8C,color:#fff
Rolling deployments update your servers in waves. Take a few instances out of service, update them, run health checks, and add them back to the load balancer. Repeat until everything’s updated.
This approach offers reduced downtime and works within your existing environment, but rollbacks become trickier since you need to individually revert each instance.
Canary Releases
flowchart TB
    subgraph Canary["Canary Release Process"]
        LB[Load Balancer]

        subgraph Traffic["Traffic Distribution"]
            STABLE["Stable Version<br/>95% Traffic"]
            CANARY["Canary Version<br/>5% Traffic"]
        end

        MONITOR["📊 Monitoring<br/>Error Rates, Latency, UX"]

        DECISION{Metrics OK?}

        EXPAND["Expand Canary<br/>25% → 50% → 100%"]
        ROLLBACK["Rollback Canary<br/>0% Traffic"]
    end

    LB --> STABLE
    LB --> CANARY
    CANARY --> MONITOR
    MONITOR --> DECISION
    DECISION -->|"Yes ✓"| EXPAND
    DECISION -->|"No ✗"| ROLLBACK

    style STABLE fill:#4A90D9,stroke:#2E5A8B,color:#fff
    style CANARY fill:#F4A261,stroke:#D4823E,color:#fff
    style EXPAND fill:#70C1B3,stroke:#4A9A8C,color:#fff
    style ROLLBACK fill:#E76F51,stroke:#C4503A,color:#fff
Named after the canaries miners used to detect dangerous gases, canary releases deploy changes to a small subset of users first. You monitor error rates, performance, and user experience closely. If the canary behaves well, gradually expand the rollout. If not, roll back with minimal user impact.
This strategy pairs perfectly with feature flags, allowing you to test new functionality on small audiences before wider release.
Feature Flags: Separating Deployment from Release
flowchart LR
    subgraph Development["Development"]
        CODE[New Feature Code]
        FLAG[Feature Flag: OFF]
    end

    subgraph Deployment["Deployment"]
        DEPLOY[Deploy to Production]
        HIDDEN["Feature Hidden<br/>Flag: OFF"]
    end

    subgraph Release["Gradual Release"]
        BETA["Beta Users<br/>Flag: ON for 5%"]
        PARTIAL["Partial Rollout<br/>Flag: ON for 50%"]
        FULL["Full Release<br/>Flag: ON for 100%"]
    end

    subgraph Cleanup["Cleanup"]
        REMOVE[Remove Flag]
        DONE[Feature Live]
    end

    CODE --> FLAG --> DEPLOY --> HIDDEN --> BETA --> PARTIAL --> FULL --> REMOVE --> DONE

    style CODE fill:#4A90D9,stroke:#2E5A8B,color:#fff
    style FLAG fill:#F4A261,stroke:#D4823E,color:#fff
    style HIDDEN fill:#6C757D,stroke:#495057,color:#fff
    style BETA fill:#70C1B3,stroke:#4A9A8C,color:#fff
    style PARTIAL fill:#70C1B3,stroke:#4A9A8C,color:#fff
    style FULL fill:#2ECC71,stroke:#27AE60,color:#fff
Feature flags represent a fundamental shift in how teams think about releases. Your code gets deployed to production, but the actual feature stays hidden behind a toggle until you’re ready to enable it.
This separation offers several advantages: reduced risk since code is deployed but not active, granular control over who sees what, improved user experience through targeted rollouts, and quick rollback capability without redeploying code.
Many organizations combine strategies—for example, blue-green deployment with feature flags—to maximize both safety and flexibility.
Infrastructure as Code: Treating Servers Like Software
Infrastructure as Code (IaC) means your server configurations, network settings, and deployment policies live in version-controlled files just like your application code. This approach brings software engineering principles—version control, automated testing, code review—to infrastructure management.
Effective IaC tools maintain state, support multiple cloud providers, offer previews of changes before applying them, and ensure operations are idempotent (running the same command twice produces the same result).
| IaC Tool | Primary Focus | Cloud Support | Language/Format |
|---|---|---|---|
| Terraform | Multi-cloud infrastructure | AWS, Azure, GCP, and 1000+ providers | HCL (HashiCorp Configuration Language) |
| Pulumi | Multi-cloud with programming languages | Major clouds | Python, TypeScript, Go, C#, Java |
| AWS CloudFormation/CDK | AWS-native infrastructure | AWS only | YAML/JSON or Python, TypeScript |
| Azure Bicep | Azure-native infrastructure | Azure only | Bicep DSL |
| Google Cloud Infrastructure Manager | GCP-native infrastructure | GCP only | Terraform syntax |
GitOps: Git as the Single Source of Truth
flowchart TB
    subgraph GitOps["GitOps Workflow"]
        DEV[Developer] -->|"1. Push Changes"| GIT[(Git Repository<br/>Single Source of Truth)]

        GIT -->|"2. Merge Request"| REVIEW[Code Review<br/>& Approval]

        REVIEW -->|"3. Merge"| MAIN[Main Branch]

        MAIN -->|"4. Trigger"| CICD[CI/CD Pipeline]

        CICD -->|"5. Apply Changes"| CLUSTER[Kubernetes Cluster<br/>or Cloud Infra]

        CLUSTER -->|"6. Sync Status"| GIT

        subgraph Audit["📋 Audit Trail"]
            LOG[All Changes Tracked<br/>in Git History]
        end
    end

    GIT --- LOG

    style GIT fill:#F4A261,stroke:#D4823E,color:#fff
    style CICD fill:#4A90D9,stroke:#2E5A8B,color:#fff
    style CLUSTER fill:#70C1B3,stroke:#4A9A8C,color:#fff
    style LOG fill:#6C757D,stroke:#495057,color:#fff
GitOps extends IaC by making Git the authoritative source for both application and infrastructure configurations. The workflow involves three components:
- Infrastructure and application configs stored as code in Git
- Merge requests as the mechanism for proposing and approving changes (with full audit trail)
- CI/CD pipelines that automatically apply approved changes to environments
This approach reduces configuration drift, enforces version control discipline, and enables easy rollback by simply reverting Git commits.
Why Staging Should Mirror Production
Your staging environment should replicate production as closely as possible—same hardware specifications, operating system, network topology, configuration, and secrets. A near-perfect staging replica catches integration bugs and performance issues before they affect real users.
This includes using identical environment variables, replicating network setups, and automating environment creation to prevent drift over time.
Managing Secrets Properly
Sensitive credentials—API keys, passwords, certificates, encryption keys—should never live in code repositories. Secrets management involves securely storing, accessing, and rotating these credentials through a centralized vault with role-based access controls and audit logging.
Automated rotation and fine-grained permissions reduce the blast radius if a secret does get leaked and help maintain compliance with security standards.
Observability: Understanding What’s Happening Inside Your Systems
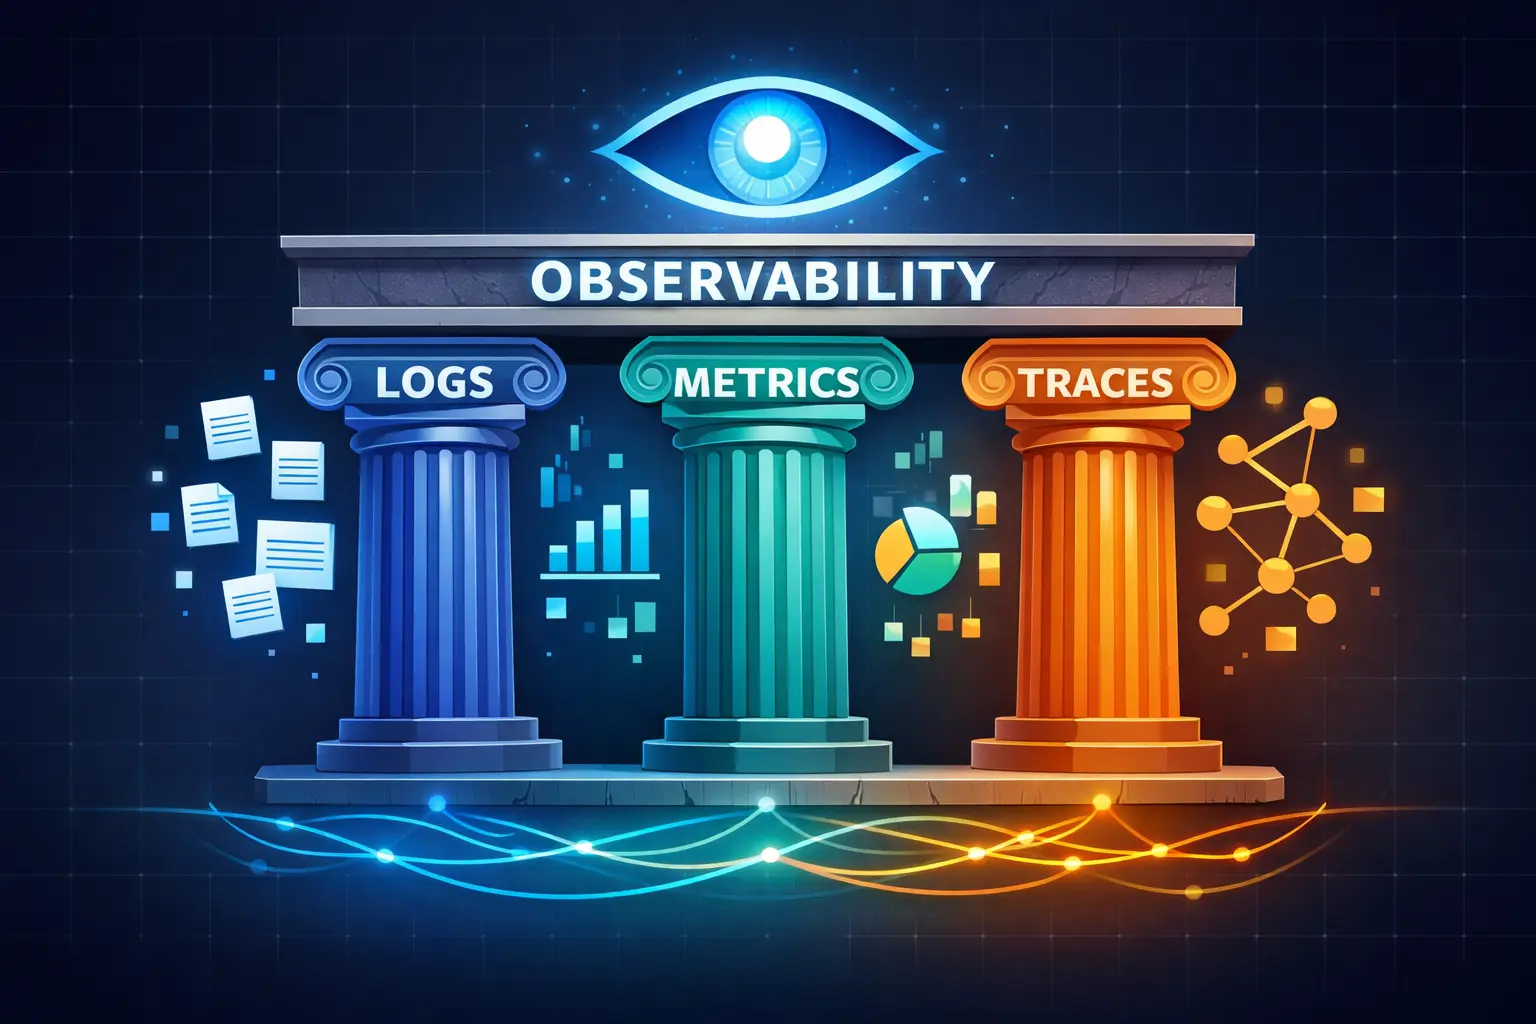
When things go wrong (and they will), you need visibility into your systems. Observability relies on three complementary data types:
| Pillar | What It Is | What It Tells You | Example Use Case |
|---|---|---|---|
| Logs | Time-stamped event records | Who did what, when, and how | Debugging specific errors, compliance audits |
| Metrics | Numeric measurements with labels | System health, trends, thresholds | CPU usage alerts, error rate monitoring |
| Traces | Request paths through distributed systems | Bottlenecks, service dependencies | Finding why a specific request was slow |
Together, these three pillars give teams a complete picture of application behavior and allow quick detection and diagnosis of issues.
Synthetic Monitoring: Finding Problems Before Users Do
Reactive monitoring only tells you about problems after users experience them. Synthetic monitoring takes a proactive approach by running scripted tests that simulate user interactions.
These “robot users” run tests at scheduled intervals, measuring availability, response times, and transaction success across different scenarios, locations, and devices. When failures occur, alerts fire before real customers are affected.
Deployment Gates and Error Budgets
flowchart TB
    subgraph Gates
        DEPLOY[New Deployment]

        subgraph Checks["Automated Checks"]
            HEALTH["Health Check"]
            PERF["Performance Check"]
            ERROR["Error Rate Check"]
        end

        BUDGET{Error Budget<br/>Available?}

        PROCEED["Proceed with<br/>Deployment"]
        HALT["Halt Deployment<br/>Investigate"]

        SLO["SLO: 99.9% Uptime<br/>Error Budget: 0.1%"]
        BURN["Burn Rate Monitor<br/>How fast consuming?"]
    end

    DEPLOY --> HEALTH --> PERF --> ERROR --> BUDGET
    BUDGET -->|"Yes"| PROCEED
    BUDGET -->|"No"| HALT
    SLO --> BUDGET
    BURN --> BUDGET

    style PROCEED fill:#70C1B3,stroke:#4A9A8C,color:#fff
    style HALT fill:#E76F51,stroke:#C4503A,color:#fff
    style SLO fill:#4A90D9,stroke:#2E5A8B,color:#fff
Automated deployment gates connect observability data with your release pipeline. These gates evaluate new changes using monitors and anomaly detection, automatically halting rollouts when regressions are detected.
Service Level Objectives (SLOs) and error budgets formalize acceptable failure rates. An error budget represents the amount of permitted error within an SLO, and burn rate measures how quickly that budget is being consumed. Monitoring burn rates allows teams to proactively halt deployments when the system is already stressed.
Runbooks and Incident Response
When incidents occur, well-prepared runbooks minimize downtime. A runbook is essentially a detailed “how-to” guide for completing common tasks—deploying updates, renewing certificates, or troubleshooting specific issues.
Runbooks capture the knowledge of experienced engineers so anyone on the team can execute procedures correctly. They can be manual step-by-step guides, semi-automated with some scripted components, or fully automated end-to-end.
For incident response specifically, runbooks standardize troubleshooting approaches, reduce escalations, and enable small on-call teams to resolve issues quickly. Automation frameworks can execute runbook steps—scaling up services, restarting pods, promoting rollbacks—and capture outcomes for post-incident analysis.
The Cultural Side: Building a DevOps Mindset
Tools and pipelines aren’t enough. DevOps is equally about culture.
Shared Responsibility and Blamelessness
Shared responsibility replaces the “throw it over the wall” mentality where developers build and ops deploys. Cross-functional teams become collectively responsible for writing, deploying, and maintaining software together.
A blameless mindset complements this approach. Instead of pointing fingers when things break, teams focus on understanding system failures and improving processes. Blameless post-mortems assume everyone acted with good intentions and emphasize learning rather than punishment. This fosters open communication and shifts the team dynamic from fear to learning.
Psychological Safety Matters
Psychological safety—the confidence that team members can take risks and make mistakes without fear of blame—underpins high-performing teams.
Recommended practices include establishing blameless postmortems as standard procedure, rewarding learning from failure rather than punishing it, creating forums for honest feedback without repercussion, and leaders modeling vulnerability by acknowledging their own mistakes.
DORA Metrics: Measuring What Actually Matters
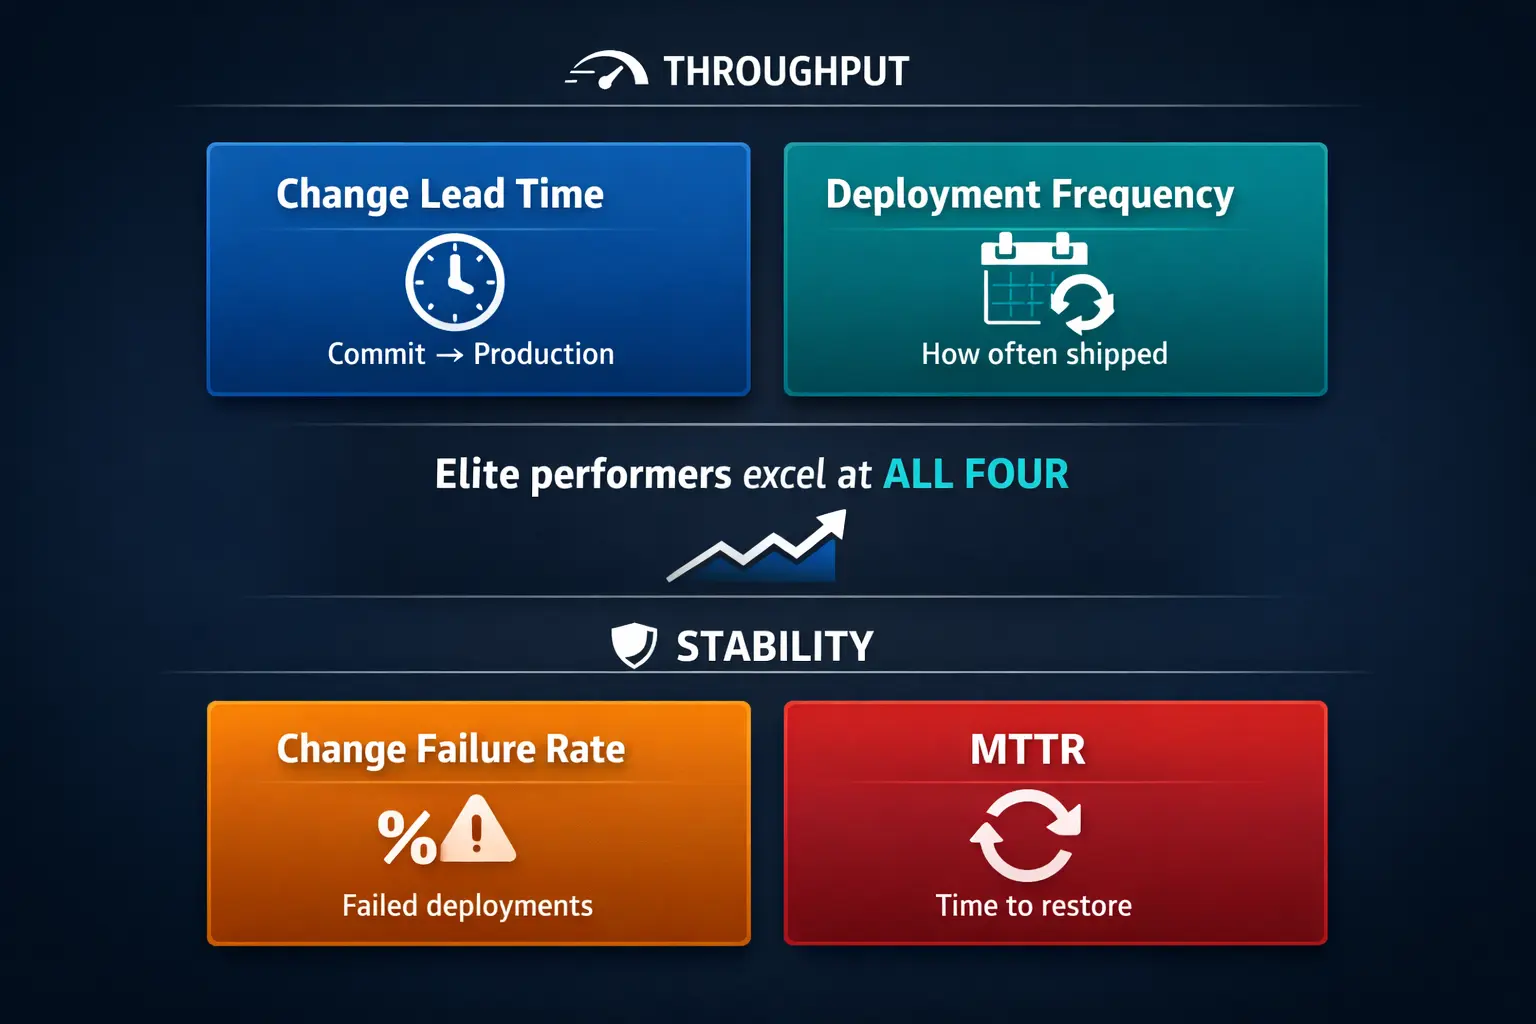
Google’s DevOps Research and Assessment (DORA) program identified four key metrics that correlate with software delivery and organizational performance:
| Metric | What It Measures | Category | Elite Performance |
|---|---|---|---|
| Change Lead Time | Time from commit to production deployment | Throughput | Less than one hour |
| Deployment Frequency | How often code reaches production | Throughput | On-demand (multiple times per day) |
| Change Failure Rate | Percentage of deployments causing failures | Stability | 0-15% |
| Mean Time to Recovery (MTTR) | Time to restore service after failure | Stability | Less than one hour |
The crucial insight from DORA’s research: speed and stability are not trade-offs. High-performing teams excel across all four metrics simultaneously. Monitoring these metrics at the service level helps identify bottlenecks, prioritize improvements, and track the impact of culture and tooling changes.
Putting It All Together
Shipping software quickly and safely requires more than just a well-configured YAML file. High-performing teams build pipelines that automate builds, tests, and deployments while embedding quality gates to catch issues early. They choose deployment strategies based on risk tolerance and infrastructure constraints, treating infrastructure as version-controlled code.
Robust observability—logs, metrics, traces, and synthetic monitoring—combined with deployment gates provides the data needed to make release decisions and trigger automatic rollbacks when service health declines. Runbooks and incident response automation ensure quick recovery when things go wrong.
Underpinning everything is a cultural shift toward shared responsibility, blameless learning, psychological safety, and data-driven continuous improvement. With these practices in place, organizations can confidently deliver features multiple times per day—without breaking things.
Sources and Further Reading
- Trunk-based Development | Atlassian
- Continuous integration vs. delivery vs. deployment | Atlassian
- The testing pyramid: Strategic software testing for Agile teams | CircleCI
- SAST vs DAST: What they are and when to use them | CircleCI
- OWASP Dependency-Check | OWASP Foundation
- Integrating Performance Testing into CI/CD | DevOps.com
- Blue-Green Deployments: A Definition and Introductory Guide | LaunchDarkly
- Rolling Deployments: Pros, Cons, And Best Practices | Octopus Deploy
- Canary Release: Deployment Safety and Efficiency | Google SRE
- Why It’s Important to Decouple Deployment from Release | Harness
- Most Effective Infrastructure as Code (IaC) Tools | Pulumi
- What is a GitOps workflow? | GitLab
- What is a staging environment? | Northflank
- What Is Secrets Management? Best Practices for 2025 | StrongDM
- Three Pillars of Observability: Logs, Metrics & Traces | Sematext
- What is Synthetic Monitoring | Dynatrace
- Deployment Gates | Datadog
- SLO monitoring and alerting using error-budget burn rates | Dynatrace
- What is a Runbook? | PagerDuty
- 4 Pillars Of DevOps Culture | Octopus Deploy
- How to run a blameless postmortem | Atlassian
- How to lead a successful DevOps transformation | LinearB
- 4 Key DevOps Metrics to Know | Atlassian
- DORA’s software delivery metrics: the four keys | DORA
Share :
Stay Ahead in Tech
Join thousands of developers and tech enthusiasts. Get our top stories delivered safely to your inbox every week.
No spam. Unsubscribe at any time.